


15 Interactive Map Templates to Create National, Regional & Global Maps


Written by:
Matt M. Casey

U.S. air carriers have had a colorful few years. Just check the headlines: dragged passengers, exploding engines and big mergers.
But headlines only tell part of the story. To get a broader look at what’s going on with U.S. air travel, we went to the data and examined records for more than five million flights.
Here’s what we found.
The worst city to travel to and from, in terms of both late departures and arrivals, is Newark, New Jersey, followed by New York and San Francisco. Meanwhile, the top city for departing and arriving on time is Anchorage, Alaska.

Although one would think flight volume would be closely related with late departures and arrivals, there are actually low-volume flight cities that still underperform. For example, Fort Wayne, Indiana has less than 3% the flight volume that New York does, yet it's on-time arrival numbers are worse than the latter's. Same with Baton Rouge, Louisiana and White Plains, New York; both low-volume flight cities with some of the worst on-time performance numbers of all cities.

If travel feels worse in 2018 than it has before, that’s not just your nostalgia speaking. Since 2010, the number of flights available to air travelers has decreased by more than a million flights per year while the number of passengers has increased.
How do those numbers add up? On the benign end, airlines have gotten better about filling all of their seats. In 2008, U.S. airlines filled 79.74% of their seat-miles on domestic flights. By the end of 2017, that number had risen to 84.57%. This means that you’re much less likely to enjoy an empty middle seat than you were 10 years ago.
But there’s another insidious factor at play; airlines have shrunk seats to increase passenger capacity. When you combine more passengers with checked bag fees that encourage customers to pack everything they can into their carry-on, it’s no surprise that running out of overhead bin space has become a common travel headache.

Glance quickly at the flight on time performance stats, and it appears that overall delays (blue bars) have remained relatively constant since 2010, with an uptick in 2013 and 2014. But this rosy picture benefits from schedule padding—practice where airlines intentionally plan for flights to arrive late to improve on-time numbers. Delta, according to a Wall Street Journal report, has increased its schedule padding every year since 2009. As a result, many flights arrive early.
When you treat all early flights as arriving on time, a bad pattern emerges: actual delays (green bar) have trended higher over the past eight years.

At first glance, it appears that the age of consolidation has pushed down the average ticket price for travelers on major U.S. carriers. But read the fine print. This data from the Bureau of Transportation Statistics “includes only the price paid at the time of the ticket purchase and do not include fees for optional services, such as baggage fees.”
That’s a big caveat, especially as major airlines made nearly 30 percent of their profits in 2017 from baggage fees. That $4.6 billion haul was up from $4.2 billion in baggage fees in 2016 and $3.8 billion in 2015. Airlines have also found other novel fees to charge consumers. In the fourth quarter of 2015, Delta made $125 million selling “Comfort+” seats and Southwest made roughly $260 million in a year on early check-in fees.
So, while a thrifty traveler can find better deals than they could before, the average traveler is paying more.

The only airline with worse arrival delay and cancellation statistics than JetBlue was Virgin America—and Virgin America doesn’t exist anymore. Even while it did, it was at least better at getting its planes off the ground on time.
On a different note, look at the flight on time performance numbers for United and Delta. Their departure delays were similar to most other airlines, but they’ve learned how to leave enough buffer in the chaos. While it’s fair to criticize schedule padding as gaming the system, Delta flights arrived at or before their scheduled time 85 percent of the time in 2017, besting all other major carriers except Hawaiian Airlines, whose network is much easier to manage.

Based on the size of JetBlue’s flight schedule and the average rate of cancellations across the industry, JetBlue should have had a about 950 cancellations due to carrier-side issues. Instead, the airline had almost double that (1,805).
And the picture gets worse. The airline also oversampled for Weather and National Air System delays, which are sometimes carrier delays in disguise.
Adding insult to injury, JetBlue had the lowest on-time percentage of all major U.S. air carriers that are still doing business, and dropped four spots in a popular annual airline ranking system.

If you have flexibility in when you travel, Tuesday and Saturday are the most reliable days of the week, in terms of arriving and departing on time. Fridays have the worst delays, followed by Monday.

On average, flight delays get worse the later in the day the flight leaves. A mechanical problem here and a weather delay there just cascades through the day. But, fly early, and everything runs well. Flights leaving between midnight and 8 a.m. tend to arrive early, on average.

Love them or hate them, late-night flights that land early in the morning are generally on-time. On average, flights between 6 a.m. and 10 a.m. actually arrive early.

Looking at the delays by hour chart, it could be tempting to blame flight volume for delays increasing later in the day, but the data doesn’t bear that out. While 5 p.m. is the busiest block, airport traffic is relatively consistent between 8 a.m. and 7 p.m. And the 9 p.m. block, which has the 4th worst accumulated misery, has the 5th least number of flights arriving or departing.

Look at the flight on time performance stats and you'll see that flight delays are at their worst during the summer vacation season and at their best in November, the month that includes one of the busiest travel days of the year.
November had the lowest rate of late flights of any month in 2017. It may be a product of schedule padding, but the average November flight actually arrived early.

The fourth largest airline in terms of number of flights in the U.S. is SkyWest. Haven’t heard of them? That’s because they’re a white-label airline who does business for Alaska, American, Delta and United.

The skyway between San Francisco and Los Angeles topped the rest of the country in raw traffic in 2017—and by a significant margin. LA and SF topped 10th-place route LA and Chicago by 47 percent!

Of the top 200 busiest air routes, Los Angeles and San Francisco also had some of the worst arrival delays.
In general, flights delays grew worse as the volume of the air route increased, but there were some notable outliers. Flights from New York to Chicago were, on average, very close to on time. Flights from Florida to Newark, in contrast, were much later than they should be.

If you’re headed to one of America’s biggest cities, or one of its major hubs, you can get a direct flight pretty easily. But if you’re trying to get from Miami to Des Moines, you’ll probably need to stop in Chicago.
The top 200 flights by trip volume in 2017 connected just 43 cities—less than 14 percent of U.S. cities with airports.
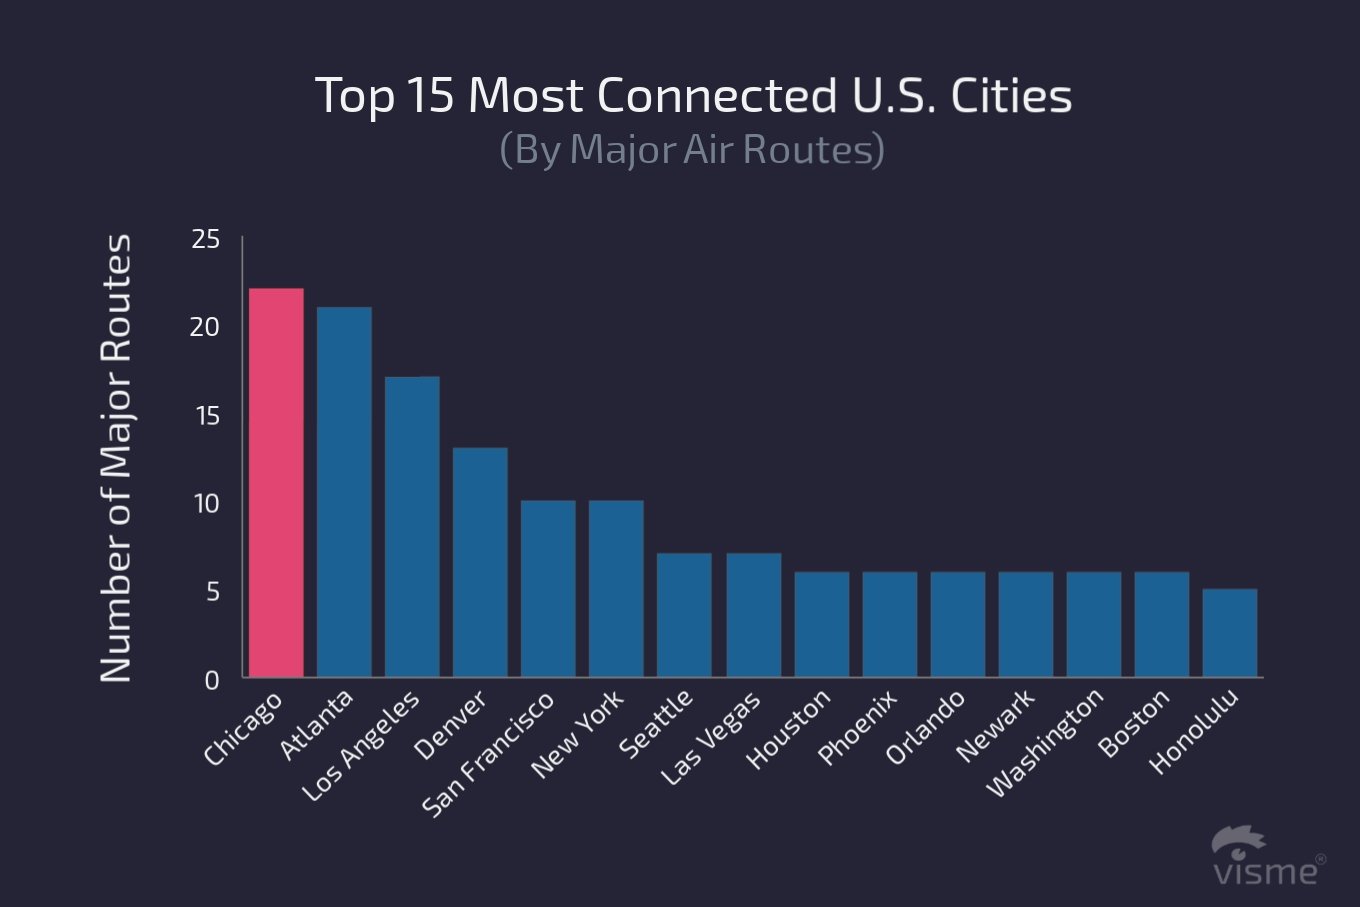
The picture looks very different when you include all air routes. Los Angeles drops from #3 to #13. Major destinations like Boston, Washington and Orlando dropped off the list entirely. Meanwhile, Dallas/Fort Worth—which didn’t even make the top 15 on connections to major routes—jumped to number 4.

The Bureau of Transportation Statistics named 312 cities with airports in its 2017 statistics on flights and flight delays, but you can only reach 205 of them on a major carrier. To reach any of the 107, you would need a private plane or a small regional carrier.

In general, airports are the victims of their networks. If you examine the flight on time performance data, you'll find that there is a nearly 1:1 relationship between the average arrival delays and the average departure delays at airports. But some are particularly awful. On the upside, anyone traveling from Martha’s Vineyard or Nantucket is probably in a Relaxed state of mind.

How has flying changed for you in the past year? Had any bad experiences you'd like to share? Feel free to drop me a line in the comments section below.
Design visual brand experiences for your business whether you are a seasoned designer or a total novice.
Try Visme for free


About the Author
Matt M. Casey is a data scientist and an award-winning journalist. His credits include The Boston Globe, WAMU in Washington, MentalFloss.com and GEEK Magazine. As a data scientist, he builds data pipelines, recommendation engines and anomaly-detection systems for startups in New York City.