


How Greater Memphis Chamber Creates Award-Winning Content While Saving Costs Using Visme


Written by:
Nayomi Chibana

Alex Kerr is the Director of Strategic Marketing at Monumental Sports, the organization that runs and owns all the operations of several professional sports teams based in Washington D.C., including the NHL's Washington Capitals, the NBA's Washington Wizards and the WNBA's Washington Mystics.
A self-described "data geek," he started doing some research on data visualization solutions after attending an analytics conference in London and came across Visme. Pleased by the vast amounts of assets and capabilities offered at very attractive price points, he decided to obtain several licenses for the social media teams at partner organizations, such as the Washington Wizards and Washington Capitals.
Since Visme is also based near the Washington D.C. metro area, we had the chance to interview Alex and his colleague Chris to find out a little bit more about their experience with the online tool. Here is what they had to say in their own words.
(You can also watch the video version of the interview below.)

Monumental Sports is the parent company of several professional sports teams. We have multiple sports properties, including the NBA's Washington Wizards, the WNBA's Mystics, the NHL's Washington Capitals, Georgetown Men’s Basketball Team, and we manage several facilities, including the Verizon Center, EagleBank Arena and Kettler Capitals Iceplex.

As Director of Strategic Marketing at Monumental Sports, I'm in charge of consumer insights, conducting different surveys and focus groups, and overseeing a number of things: digital properties, our email marketing database, access to the website, social numbers, any digital asset that moves on the marketing side, as well as analytics and marketing strategies.

What differentiates us is that we’re a multi-property team. Most teams have a single ownership.
Also, we’re involved with the community. DC's market is very different from other sports organizations. Since we’re located in a very transient city, the way we market to fans is a bit different. There are multiple venues through which we operate, such as Monumental Network's website.
I was looking for tools online, doing research on data visualizations and stumbled across a blog post. It compared Visme to a lot of other data visualization tools.
After taking a closer look at the product, I decided to go with it for a number of reasons: 1) a lot of robust features and different applications; 2) I could make visually engaging infographics and presentations.
Previously, I was creating them with PowerPoint, but I had greater needs. I had been using PowerPoint for so long, as well as a lot of graphs from SPSS and Excel, which can look boring at times; you can tell a better story through data visualizations and presentations.
What I liked the most was being able to create formal and informal presentations of data and put together a compelling slide deck or infographic, which serves our purpose far better. It catered to all the different possible needs for distributing data.

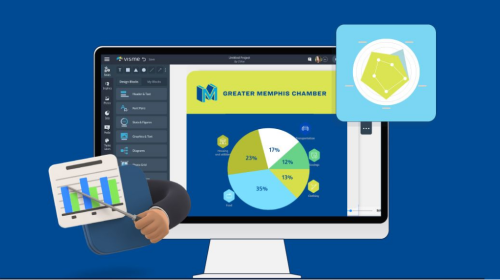
Create engaging infographics like this using Visme
One of the most important presentations we create every year is an annual study for the Capitals and the Wizards. We ask a lot of different questions to create a brand study that can be presented to the organization. We used Visme to display those results within the presentation.
We also created two types of infographics: 1) ones that reflect survey data from consumer insights initiatives; and 2) reporting for internal use, either to the CMO or different types of sales teams. The social team also uses Visme on a regular basis for social initiatives and to communicate levels of online performance internally and externally, both project-based and social-media based.

I like the locking tool, the dial graphs with the percentages inside. We use these a lot for the information we’re putting out.
I’m kind of a data nerd, so I wanted to create something beautiful in a way that was easy to digest. It’s helpful for me to preview infographics and the different templates to look at what type of infographic best fits my needs and will help make my case in the best possible way.
It’s very helpful for visualizing data, especially for someone who doesn’t have a graphic design background.

I originally started with a license that I bought, and I very quickly decided that we needed to expand its use to different partner organizations, such as the Washington Capitals and Washington Wizards. So it was recommended internally to the social teams.
Visme helps turn very boring, non-stimulating information in Excel or PowerPoint into something that is portrayed in a digestible way, which then becomes more actionable. This is the main reason I would recommend it.
Although the tool has improved a lot in the last months, I think it would be helpful to have the ability to group elements. Also, the undo button undoes the last element moved, but not any movement related to text.
Design visual brand experiences for your business whether you are a seasoned designer or a total novice.
Connect with Sales

About the Author
Nayomi Chibana is a journalist and writer for Visme’s Visual Learning Center. Besides researching trends in visual communication and next-generation storytelling, she’s passionate about data-driven content.