


How to Make an Interactive Infographic [+Templates]
![13 Types of Infographics You Should Be Creating [Plus Templates]](https://visme.co/blog/wp-content/uploads/2015/11/Header-1200-60-500x280.jpg)
Written by:
Chloe West

If you’re looking to create an infographic to visualize your data and/or information, there are several types of infographics you need to be aware of.
Each type of infographic has a different purpose and is used to showcase different types of data or information.
In this post, we go over the top 13 types of infographics and include examples (all of which are editable templates in Visme!) to help you get started.
Here’s a short selection of 8 easy-to-edit infographic templates you can edit, share and download with Visme. View more templates below:


Learn more about these 13 different types of infographics that you should be creating below.

Embed on your site:
<script src=”//my.visme.co/visme.js”></script><div class=”visme_d” data-url=”y4yyop1x-13-types-of-infographics” data-w=”1200″ data-h=”8720″></div><p style=”font-family: Arial; font-size: 10px; color: #333333″ >Created using <a href=”http://www.visme.co/make-infographics” target=”_blank” style=”color: #30a0ea”><strong>Visme</strong></a>. An easy-to-use Infographic Maker.</p>
Download full infographic here

As its name implies, this type of infographic incorporates different charts and graphs into it to showcase various statistics. For example, the demographics report above includes pie charts, pictograms, a bar graph and a map.
This mixed bag of charts and graphs is the best option when you have many statistics, facts and figures to communicate to your audience.

Another common type of infographic is the list-based or informational visual.
This type of longform graphic is composed mostly of text and doesn’t rely as much on graphs, charts or other visual elements, as seen in the colorful infographic above.
While the information is enhanced with an attractive color scheme and icons, overall the words are what really drives the message home.


Whenever you want to show how something has evolved over time or want to tell a story in chronological order, this type of infographic is the most useful in getting your point across.
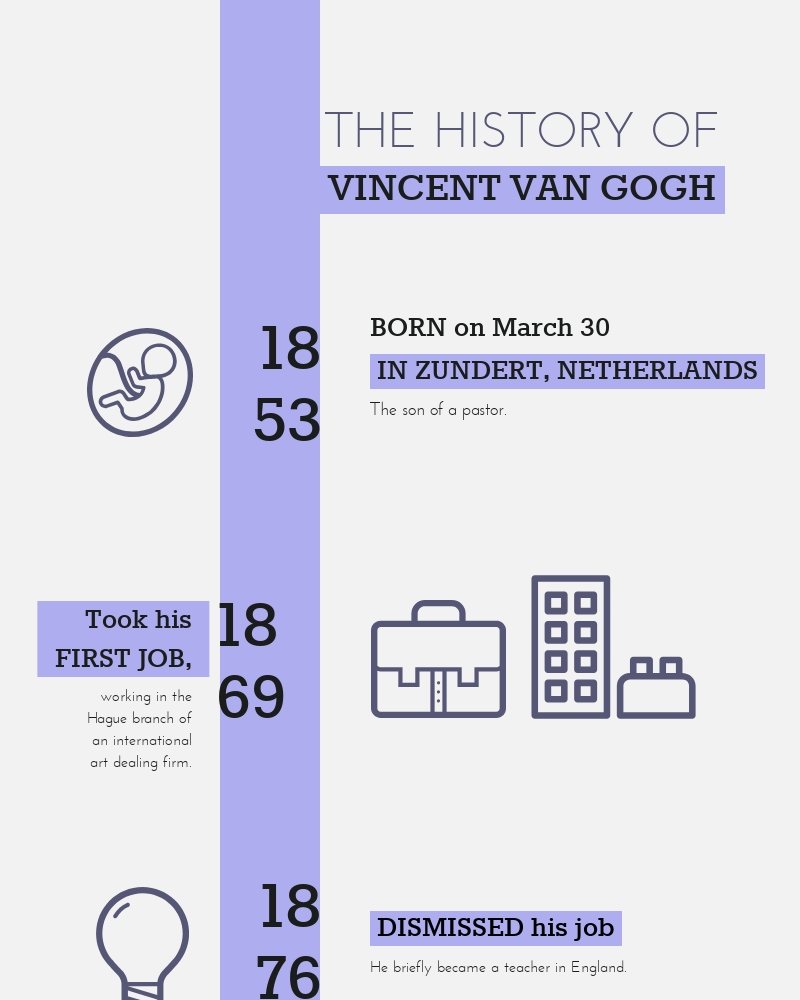
Timelines can be used for everything from brand stories to resumes to the historical development of a trend, person or product.
They’re most effective when they incorporate many different data points spread out across time and are accompanied by images, icons and other graphic elements, as seen in the timeline above.
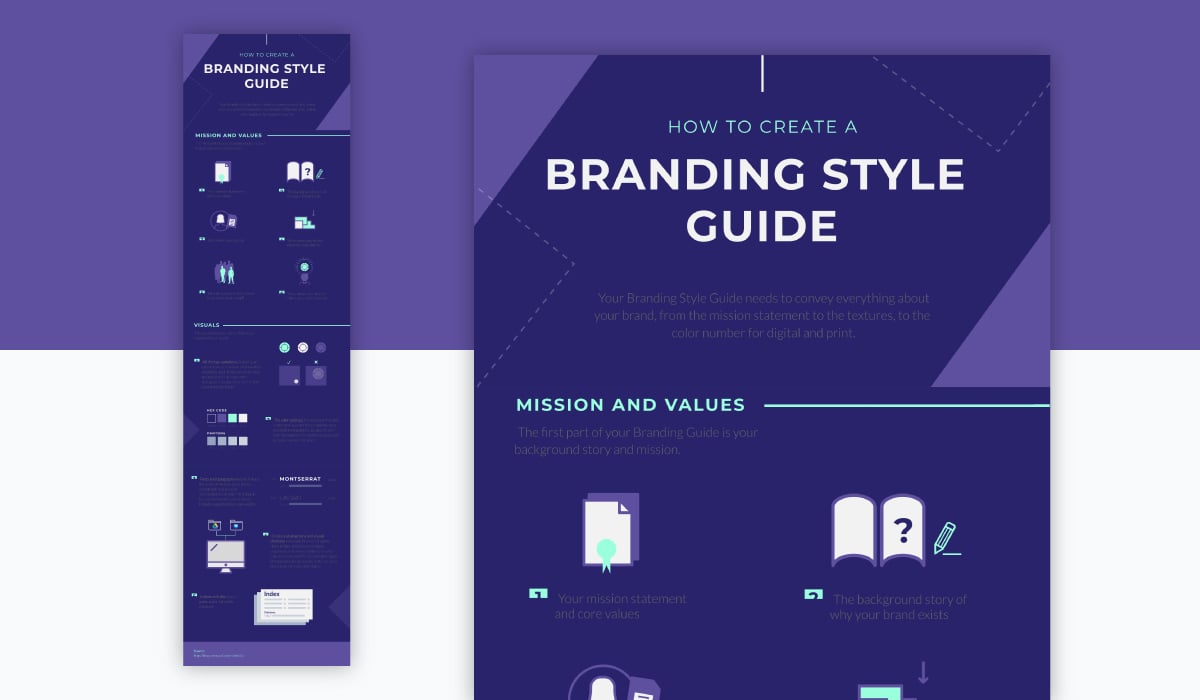
These types of infographics show the steps involved in creating something. For example, the visual above shows readers how to create a branding style guide.
This format is best suited for visualizing how-to articles and the description of any procedure with several instructions to follow.

Although this visual format may seem similar to a timeline, it’s different in the sense that it refers specifically to the description of a process.
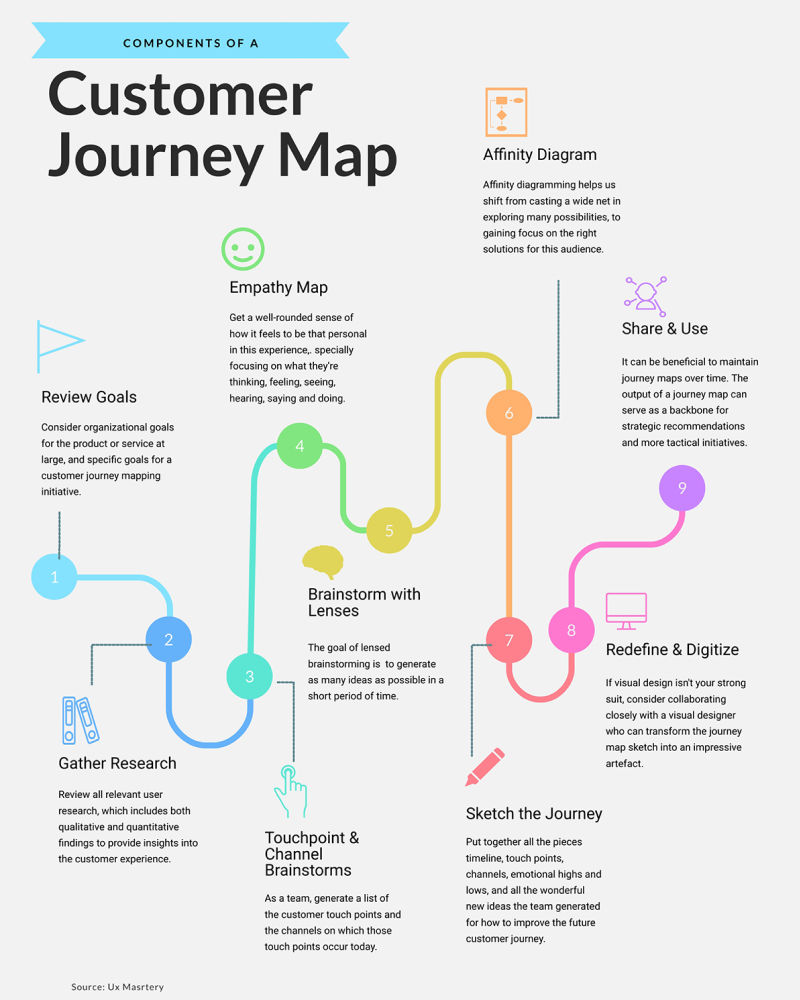
This will often showcase a step-by-step process, like we see above in the customer journey. This can also be a process for creating an online course, putting together a business plan or even the process of making a decision.

Another common use for infographics is making comparisons between two products, people, ideas, things, events or places.
Besides comparing two products side by side, this type of infographic can also be used to visually contrast and compare seemingly opposing things to reveal similarities, differences and relative advantages.

One of the easiest ways to visually communicate trends across a region – local, national or global – is to use a location infographic.
Usually in the form of a map with icons and color-coded regions, this type of visual is ideal for comparing regional and global statistics on a relevant subject that readers care about.
For example, one idea could be a map of crime rates across different states, and another could be comparisons of cost of living. This could also be used to show a visual representation of the expansion of a company across the world.

A flowchart infographic can be used in a variety of different ways. You can showcase a team heading up a project, like we see above, or an organization’s team hierarchy.
You can also showcase decisions, processes and other types of information with a flowchart. These can be easily customized with lines and shapes to create any type of visual flow to share with an audience.

This type of chart organizes information according to levels – whether it be level of importance, level of difficulty, income level, etc.
Although most commonly seen in the shape of a pyramid, as in the example above, this type of infographic can also be seen in the form of an organizational chart.
The key function of this type of visual is to compare the different levels and show the relation between each of them.

As the name implies, single-chart infographics simply use one chart type as the focal point of the data visualization. In comparison with statistical infographics, this one performs much better in terms of shares and views on social media platforms.
In a study of more than 16,000 infographics conducted by Visual.ly, it was found that the top-shared infographics were all easy to understand, simple and not very text-heavy.
In line with this trend, the top three most popular infographics were flowcharts, single charts and list-based infographics.

We’ve all seen these kinds of infographics floating around the Internet – the ones with various stats and figures visualized using large numbers, icons or other graphic elements.
The purpose of this type of infographic is simply to provide a number, or a set of numbers, in a much more visually appealing way than within a paragraph of text.

This type of infographic uses visual metaphors such as the human body to display information. In this example, we’re using a visual of a man working at a computer to display the anatomy of an information designer.
Alternatively, you can also make use of less figurative anatomical infographics by using representations of objects and displaying the parts that make up their anatomy, such as the anatomy of the perfect website, or the anatomy of an online presentation.

Many job candidates have resorted to turning their text-based Word resumes into visually captivating infographics.
Hannah Morgan, author of the book The Infographic Resume, advises using visuals with a purpose, such as charts that highlight key statistics and accomplishments.
She especially advises using these types of infographics in industries that are the most open to non-traditional resumes: marketing, advertising, graphic design, high tech and startups.
Once you've decided on the type of infographic that best suits your content, you can start creating your own by experimenting with any of the online infographic tools out there right now.
Visme, for example, is an online infographic tool that provides users with hundreds of templates to start with, across all of the infographic types mentioned above.
Design visual brand experiences for your business whether you are a seasoned designer or a total novice.
Try Visme for free


About the Author
Chloe West is the content marketing manager at Visme. Her experience in digital marketing includes everything from social media, blogging, email marketing to graphic design, strategy creation and implementation, and more. During her spare time, she enjoys exploring her home city of Charleston with her son.