


How to Make an Interactive Infographic [+Templates]

Written by:
Kayla Darling

Infographics are amazing tools—they can take otherwise boring or hard-to-digest information and transform it into something interesting and even fun for audiences. Entrepreneurs quickly latched onto these visuals and made them their own.
However, infographics have appeal beyond the marketing world. Specifically, they can be really useful for students.
Most of the time when you think about infographic examples for students, you’re likely thinking about the presentations they might give in the classroom, but they actually have quite a few more applications. Infographics are excellent tools for teaching, as well as for assignments, or even just preparing students for what comes after graduation.
RELATED: How Students Can Use Timeline Templates in the Classroom
Create interactive infographics like this with Visme.
Sometimes, a subject in school just isn’t very engaging. Whether it’s math, science, or English, not all students are going to be able to get into every topic. That’s where infographics prove useful as teaching devices, as they provide ways to create more engagement with students.
Samiran Ghosh reposts an article by Dawn Casey-Rowe on some excellent ways to use infographics in English class. The author states that while learning how to tell stories that resonate with others is an important skill, the way most of us digest stories these days isn’t through the typical book—and that aside, classic works like Moby Dick and Hamlet use elevated language and themes that most students aren’t running into on a daily basis. Infographics, therefore, can put this information into a more accessible form.
Casey-Rowe gives several examples of ways to teach literature using these tools, one of which is to create infographics on whatever story the class is studying at the moment. She gives three main ways to go about this:
The article is filled with other examples, such as creating an infographic on Shakespearean insults, or on the relationships of villainous characters between various stories.

Via Visual.ly
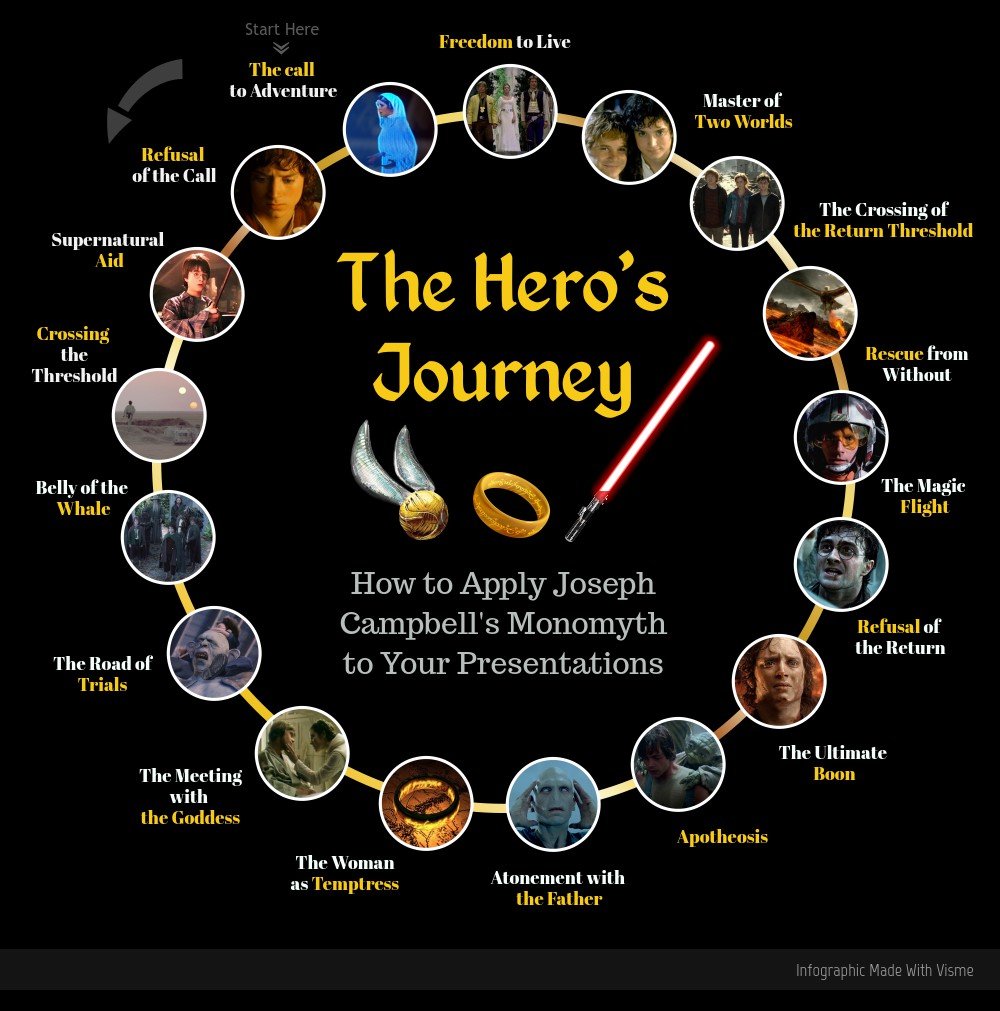
The visual format gives an easy way to see how the different elements interconnect.
For example, you could have an infographic focusing on a specific character’s actions, with arrows leading from the character towards the personality traits that directly led to certain actions taken, and then further towards the events caused by these actions. The direct line of cause-and-effect simplifies some of the more complicated themes and advanced language, helping readers appreciate the story more now that they don’t have to dig through walls of text to get to it.
Infographics can just as easily be used in other teaching formats, as Michele Haiken shares. She mentions that she would put infographics up for students to study before class began, asking them to analyze the infographics on various different aspects, such as style, and figure out how they worked and how they didn’t.
Haiken also presented infographics on challenging subjects to some classes in order to spark conversation and debate. Much like with literature, the visual format helped make what would otherwise be very heavy and difficult topics more easily accessible to students.
However, Haiken, like many others, discovered an even better use for infographics: assignments.
The next logical step from teaching infographics would be to hand them out as assignments. Using infographics as assignments helps to put what students may have learned through studying infographics into practice and, like any good assignment, cements the teaching.
April Lawrence goes over several reasons to assign infographics as projects, those reasons being:
Lawrence goes on to give examples of how to create these assignments, starting with examining different infographics and analyzing them—much like the examples in the previous section—and then moving on to having students create their own infographics.

Student project created with Visme
Stefanie Jochman provides one such example of an assignment like this working well. After realizing that some of her earlier methods in handing out assignments might have been too stifling, she turned to infographics for a more open solution.
After presenting an infographic of her own, she had her students research infographics on difficult topics, and then post questions that they had on those topics. Their homework was to continue researching infographics and, through this research, they came up with much more authentic answers to their questions, which they would then use as an assignment writer.
Infographics can also be used as an aid for students to create in order to better understand various concepts, or, as they are usually used, as a different way to give a presentation. They can also be used to help better understand design elements and how to combine different forms of media.

We’ve seen how infographics can help students learn, and how they can be used as projects, but what about the next steps?
Infographics can be quite useful in helping students see and understand what waits for them beyond graduation, and help them plan for that future.
Tracy Tonnu lists several examples, some of which address similar topics to others on the pages, and some that address rather unique topics, but all of which prove useful in helping future graduates plan.
In a world steadily growing in new technology, online courses have become quite common. They allow students to take a course they may not be able to otherwise, and many colleges offer online courses. This option for education may be appealing to students, and this infographic details what’s good and what’s bad about the process.
Some of the benefits of online courses are that there’s less travel involved, and students can complete assignments when it’s convenient for them, rather than trying to squeeze them into a deadline. Some of the cons were that software problems can interrupt classes and that there isn’t as much interaction with other people, denying students that life-building opportunity.
The infographic example for students also compares online education with traditional education, as well as providing ratings from professors, allowing readers to figure out which method is right for them on their own.

Via Visual.ly
This example is quite a bit more ornate than the previous, and addresses a heavier topic: paying back student loans after college.
The infographic is quite in-depth, and examines how student debt became such a big issue, starting all the way back in 1965, and describing how student debt can no longer be discharged after several amendments. They then give a map of how the process of accruing student debt works, and why it’s grown so much.
The infographic paints a rather bleak picture for college graduates, as it shows how hard it is to pay off debt once gained, and shows it in such a way that it’s hard for the information not to sink into any worried graduate or pre-graduate’s brain.
Thankfully, the infographic doesn’t simply stick to explaining a hopeless process, but gives ways to help avoid debt, those being:
The layout makes the infographic easy to follow, and can help future graduates decide how to pay for further education before they’re faced with that massive choice—or if future education is even right for them at the time at all.
Social networking is something many people use in the present day. This infographic shows how it’s being used in classrooms, and how it can actually benefit students.
The infographic gives statistics on social networking, and reports that over half of students who have blogs talk about school work, which can be anything from what they’re doing in class to offering educational advice.
Further down, you can find statistics on how many schools use social networking in the classroom, and on programs that incorporate it.
The infographic includes quotes that support the use of social networking in an educational platform, as well as providing a creative format with aspects that appeal directly to a teen and young adult demographic.
This infographic would likely be rather interesting to students, as it combines education with something that’s prevalent in their social lives, as well as allowing them to see what benefits using social media can actually provide.
The infographics listed on this site are not the only ones that provide valuable information for students, however. College students, in particular, will find the infographic re-posted by Judy Hanning rather useful.

Via Visual.ly
The infographic itself, titled “A Cure for the Stressed Life of a College Student,” is about exactly what the title claims--why college students can become so stressed, and how to help alleviate it.
After listing some statistics on reasons college students might be stressed--such as financial issues and schoolwork--the infographic lists some helpful apps that can actually decrease a student’s stress in different situations.
For example, the “Time Management” stressor has an app known as “Evernote” listed beneath, which automatically turns notes into flashcards, and the “Financial” stressor has an app called “Debt Tracker” beneath, which not only keeps track of bills, but helps formulate a plan to pay them.
The infographic is a wonderful survival guide for college students, with numerous helpful apps and tips provided in an easily-accessible form.
A similar infographic can be found on eLearning Infographics, only focusing on exam stress rather than general college stress. What’s useful about this infographic is that it gives suggestions that aren’t solely focused on apps, such as exercising or meditating.
Examples of infographics for students, similar to these, can be found all over the web, and can also be easily created by users who want to share their own survival guides or school hacks.
Infographics can easily be applied to a number of situations, especially in the world of education. Let us know some of the ways you’ve seen them used, or some of your own ideas, in the comments below.
These are just some of the ways students can use infographics as guides or learning assignments. What other ideas do you have for implementing infographics in the classroom and beyond? Let us know in the comments section below.
And if you're looking for a free infographic tool for students or teachers, you can try this tool, which allows you to create interactive charts, graphs and maps as well.
Design visual brand experiences for your business whether you are a seasoned designer or a total novice.
Try Visme for free


About the Author
Kayla Darling is a writer from Rome, Pennsylvania who has been writing and posting stories online for years. She graduated from Lycoming College with a degree in Creative Writing and a minor in Psychology. She has a passion for community service and storytelling, and probably spends an inordinate amount of time doing both.